CAICT · Third-party test report
Seismic & Load
A Chinese national laboratory put our IT cabinet on a shake table and ran it through seismic intensity 8 and intensity 9. The whole report is on this page, sheet by sheet.
Test bodyChina Telecommunication Technology Labs (CTTL)
BasisYD 5083-2005
SampleTR-61220 · 600 × 1200 × 2000 mm
ResultPASS — no structural damage
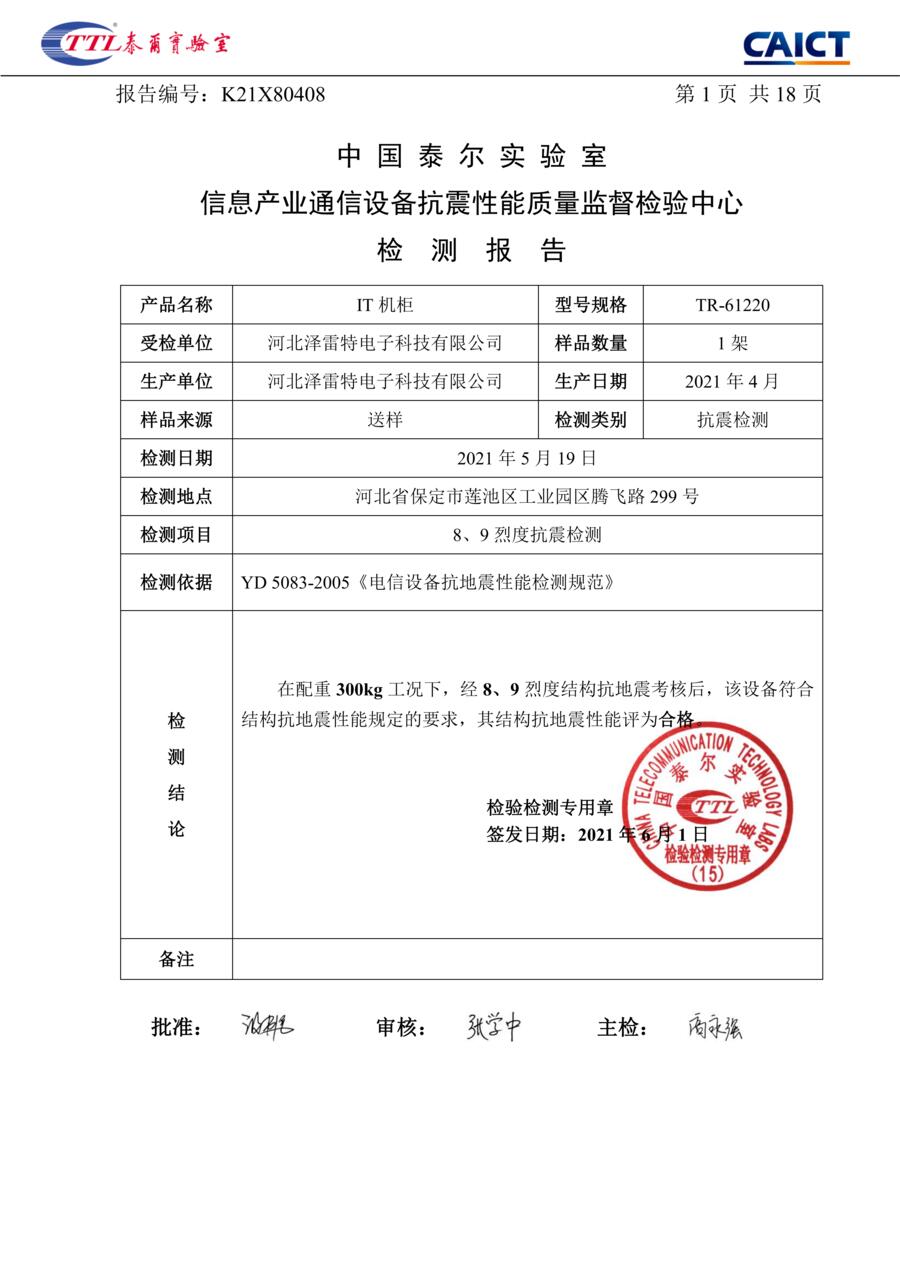
Conclusion, page 1 of 18
The numbers to copy into a technical requirement.
Transcription
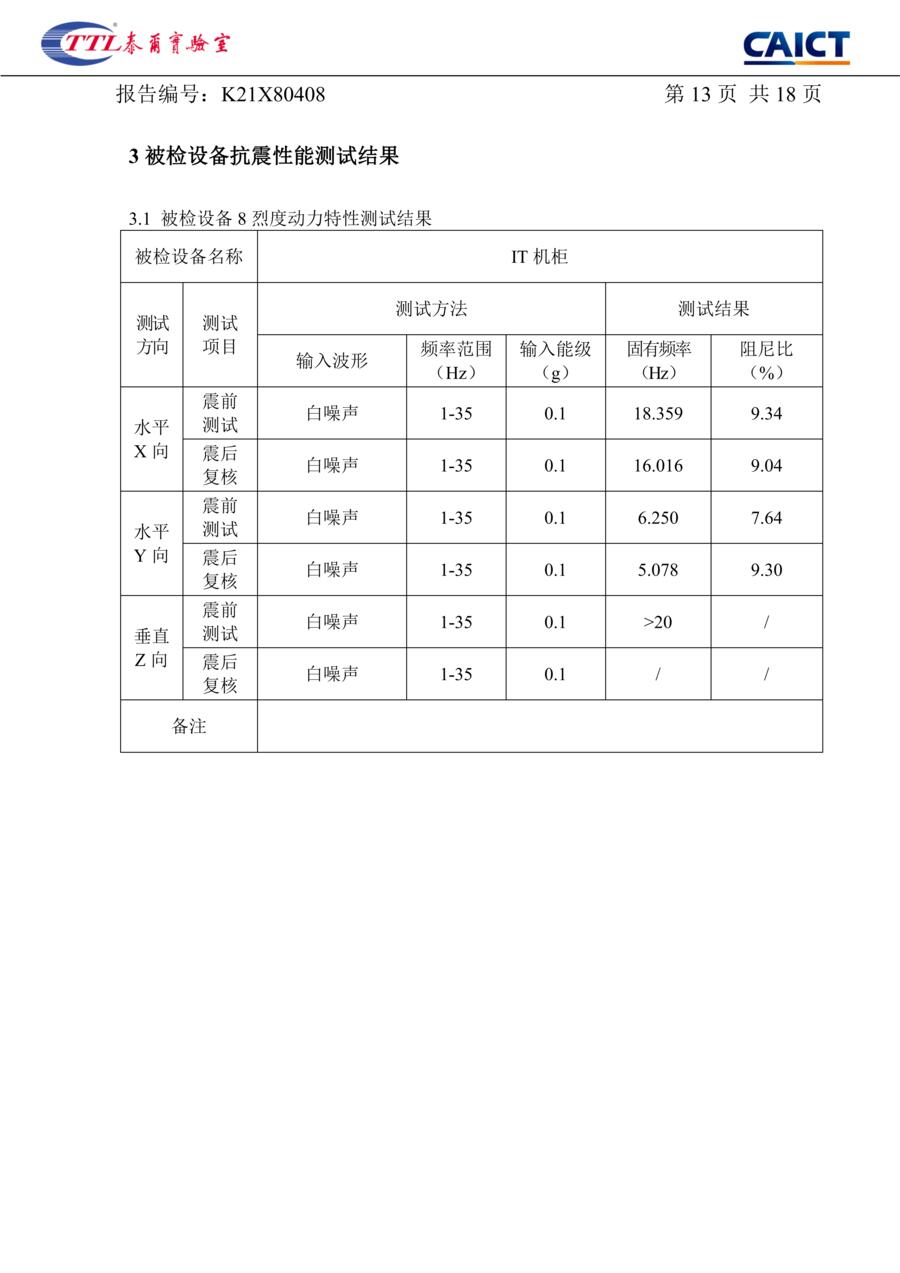
The four result tables, in English and unrounded.
| Direction | Item | Natural frequency (Hz) | Damping ratio (%) |
|---|---|---|---|
| X horizontal | Pre-test | 18.359 | 9.34 |
| X horizontal | Post-test recheck | 16.016 | 9.04 |
| Y horizontal | Pre-test | 6.250 | 7.64 |
| Y horizontal | Post-test recheck | 5.078 | 9.30 |
| Z vertical | Pre-test | >20 | / |
| Z vertical | Post-test recheck | / | / |
Source: test report, page 13
| Direction | Item | Natural frequency (Hz) | Damping ratio (%) |
|---|---|---|---|
| X horizontal | Pre-test | 16.406 | 10.56 |
| X horizontal | Post-test recheck | 15.234 | 13.49 |
| Y horizontal | Pre-test | 5.078 | 8.02 |
| Y horizontal | Post-test recheck | 4.688 | 12.02 |
| Z vertical | Pre-test | / | / |
| Z vertical | Post-test recheck | / | / |
Source: test report, page 15
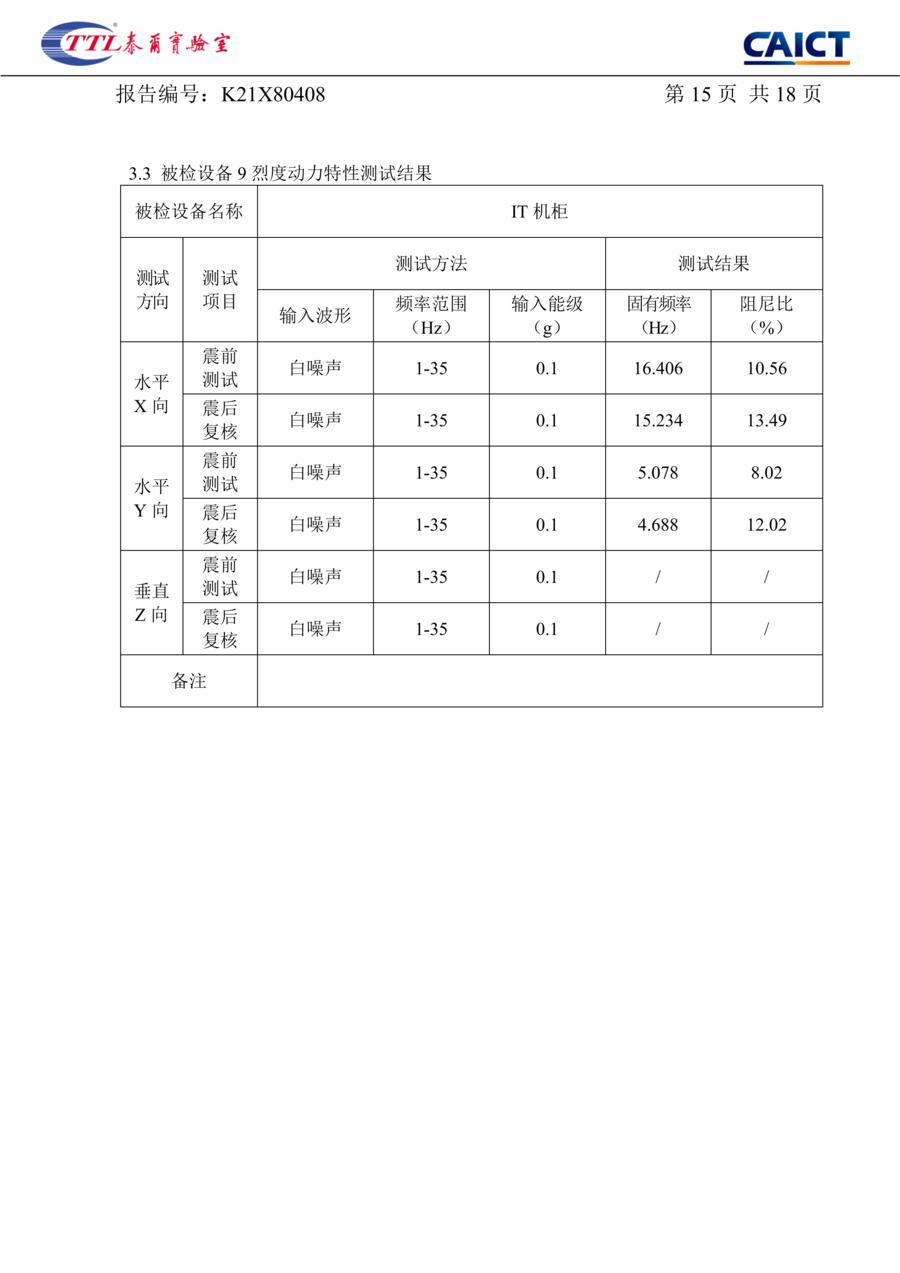
| No. | Direction | Test waveform | Peak input accel. (g) | Peak response accel. (g) | Structural damage after test | Verdict |
|---|---|---|---|---|---|---|
| 1 | Horizontal X | Synthetic earthquake wave | 0.660 | 0.889 | None | PASS |
| 2 | Horizontal Y | Synthetic earthquake wave | 0.660 | 2.159 | None | PASS |
| 3 | Vertical Z | Synthetic earthquake wave | / | / | / | Not assessed |
Source: test report, page 14
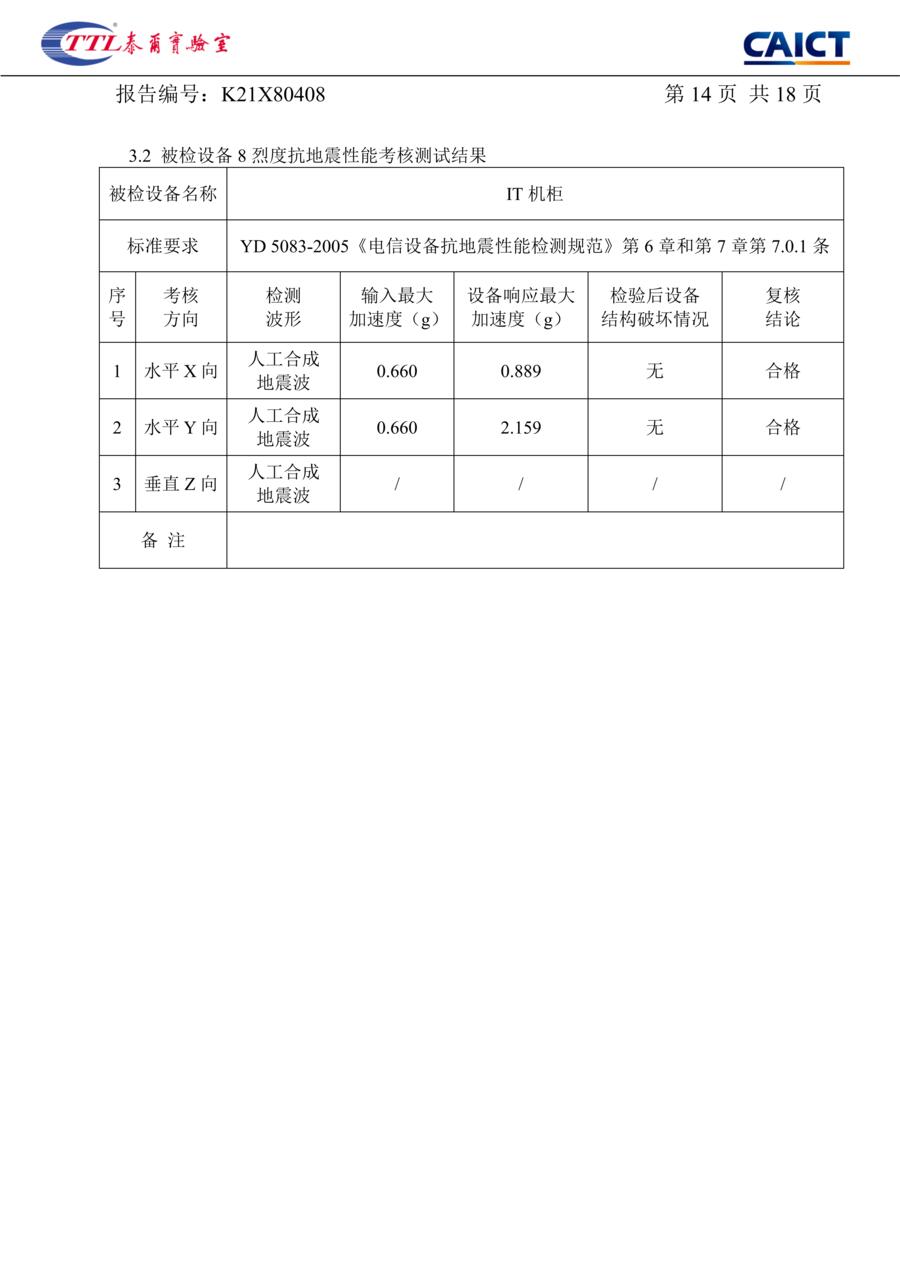
| No. | Direction | Test waveform | Peak input accel. (g) | Peak response accel. (g) | Structural damage after test | Verdict |
|---|---|---|---|---|---|---|
| 1 | Horizontal X | Synthetic earthquake wave | 1.320 | 1.705 | None | PASS |
| 2 | Horizontal Y | Synthetic earthquake wave | 1.320 | 4.517 | None | PASS |
| 3 | Vertical Z | Synthetic earthquake wave | / | / | / | Not assessed |
Source: test report, page 16
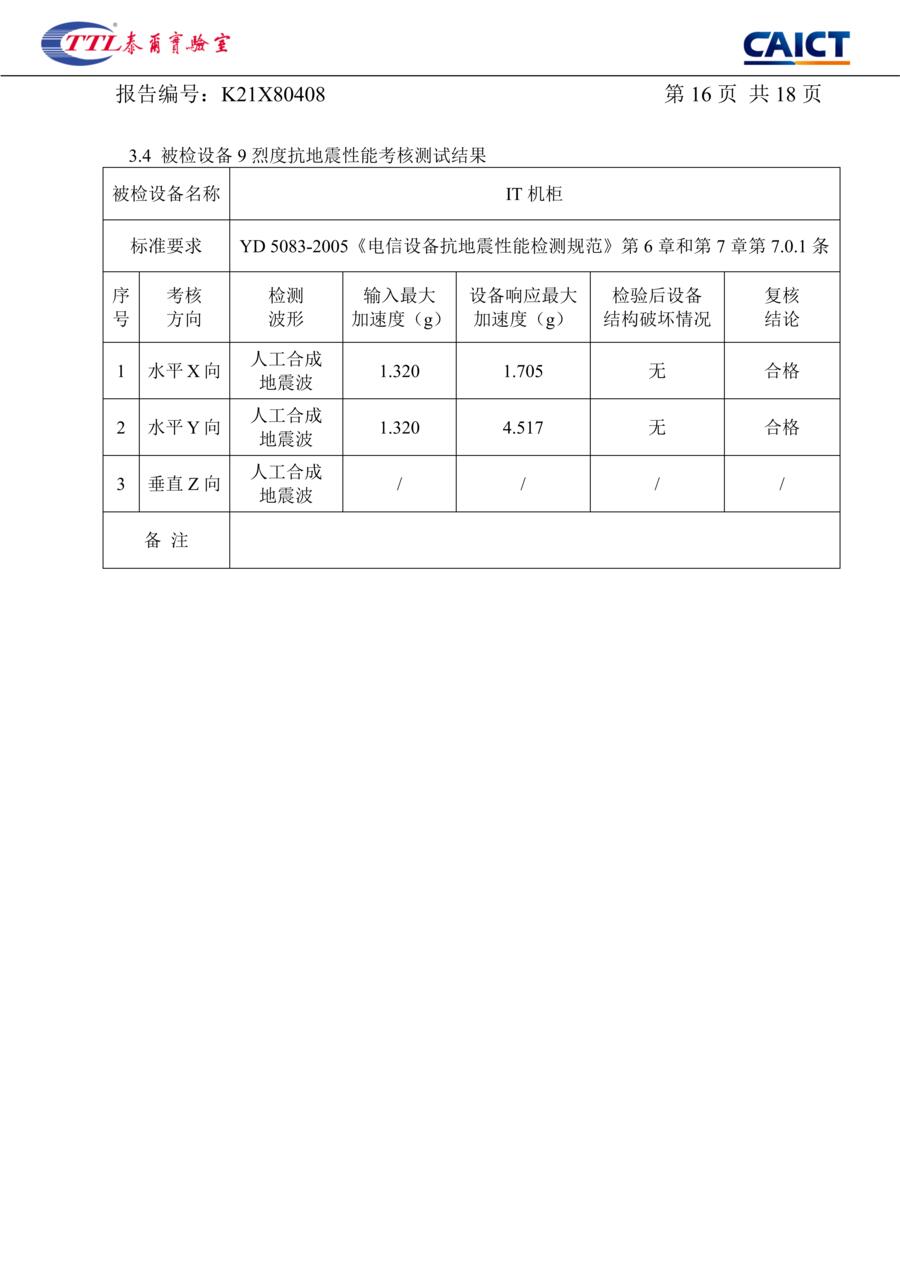
Source: test report, pages 13–16. The vertical direction was not assessed; the report prints a slash in those cells.
Fixture
Half of a seismic result is how the sample was held.
- 01Sample built to the production drawing, with 300 kg of ballast in five trays.
- 02Four accelerometers fitted; natural frequency and damping measured by white-noise sweep, 1–35 Hz.
- 03Synthetic earthquake wave applied in X and Y at the intensity 8 level, then at the intensity 9 level.
- 04Sweep repeated after each level and compared against the pre-test values.
The report · front sheets and pages 1–4
The report, sheet by sheet: what was tested, and how it was held.
Twenty-one scanned sheets in all: the cover, the front notes, the contents, then the eighteen numbered pages of the report itself.
A · Front matter
-
cover
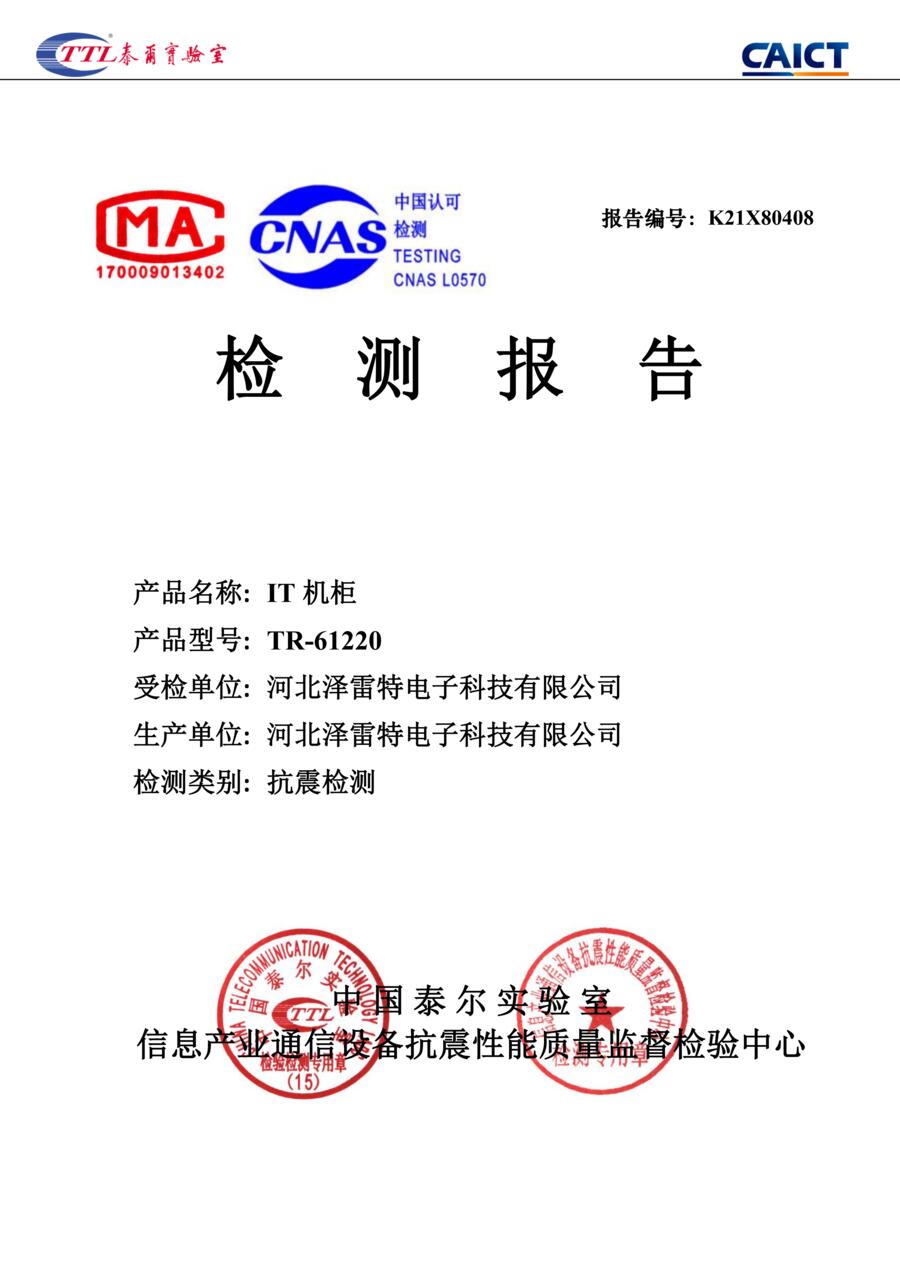
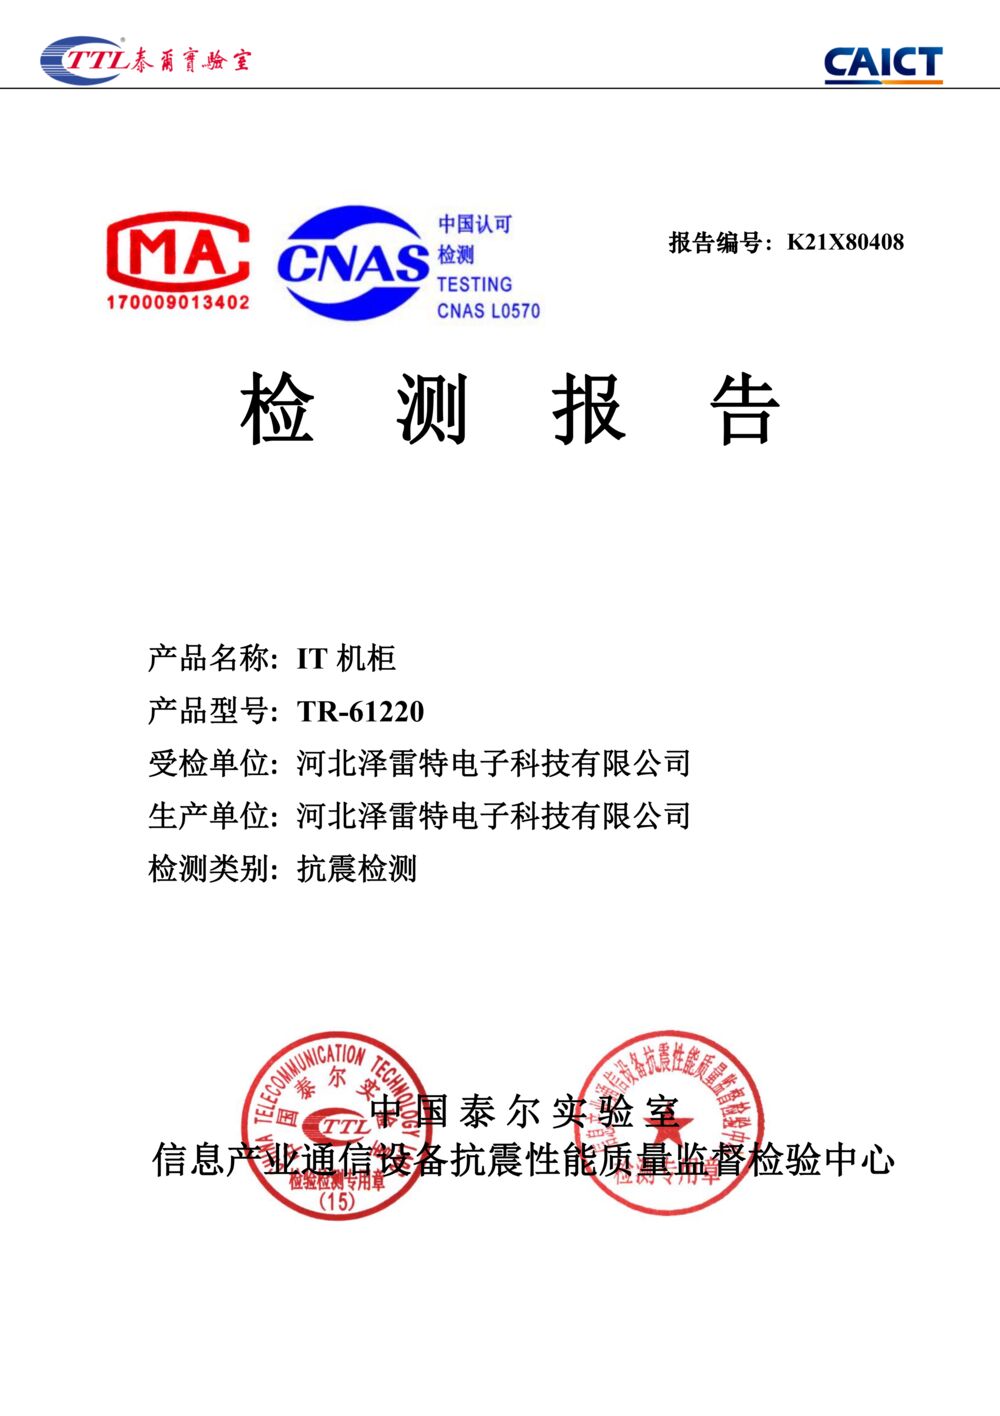
Report cover. Product: IT cabinet, model TR-61220. Applicant and manufacturer: Hebei Zereite Electronic Technology. Issued by China Telecommunication Technology Labs under CAICT; CMA and CNAS marks.
-
notes
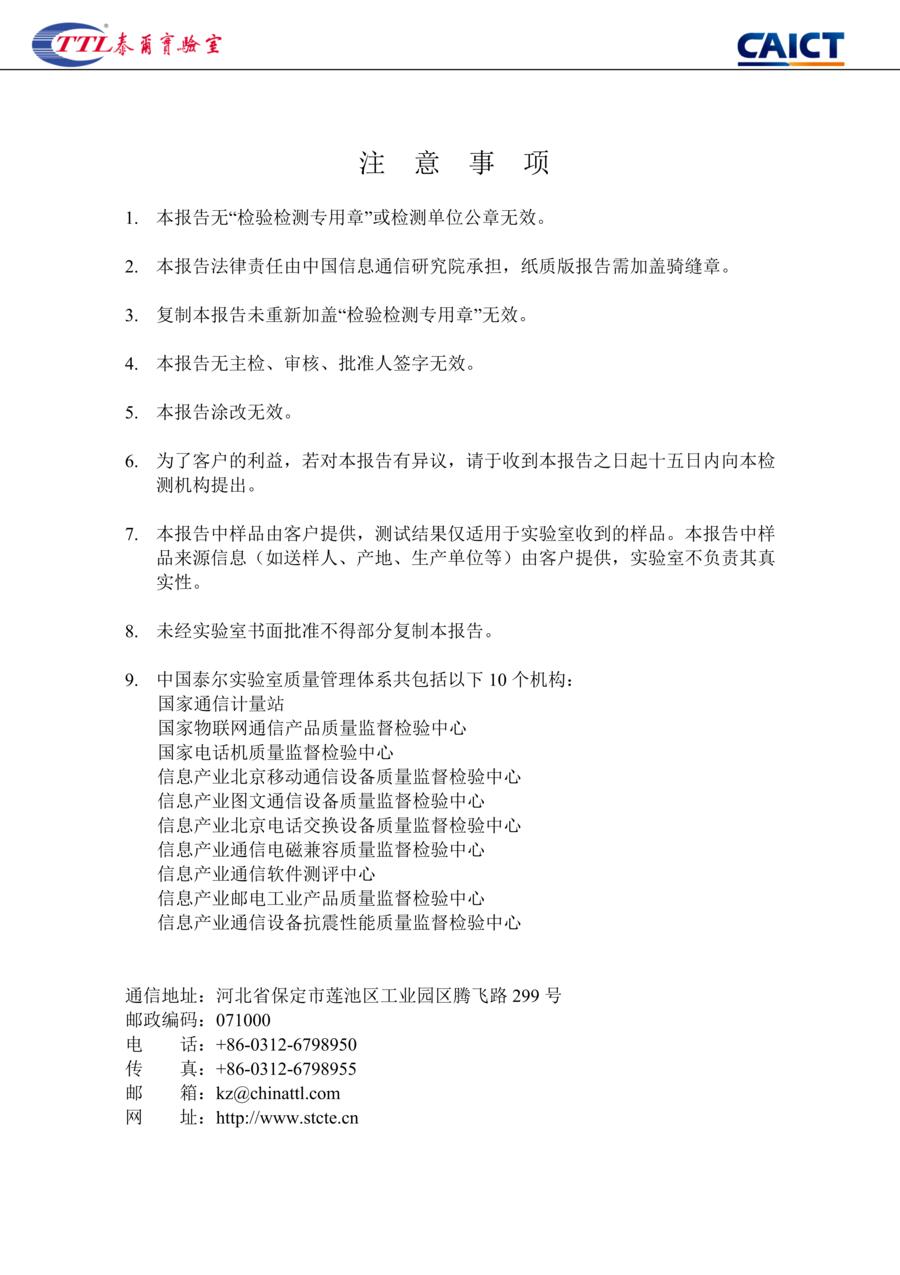
Front notes. Nine conditions, among them: valid only with the inspection seal; invalid without the three signatures or if altered; objections within 15 days; no partial copying without written approval; sample information supplied by the client.
-
contents
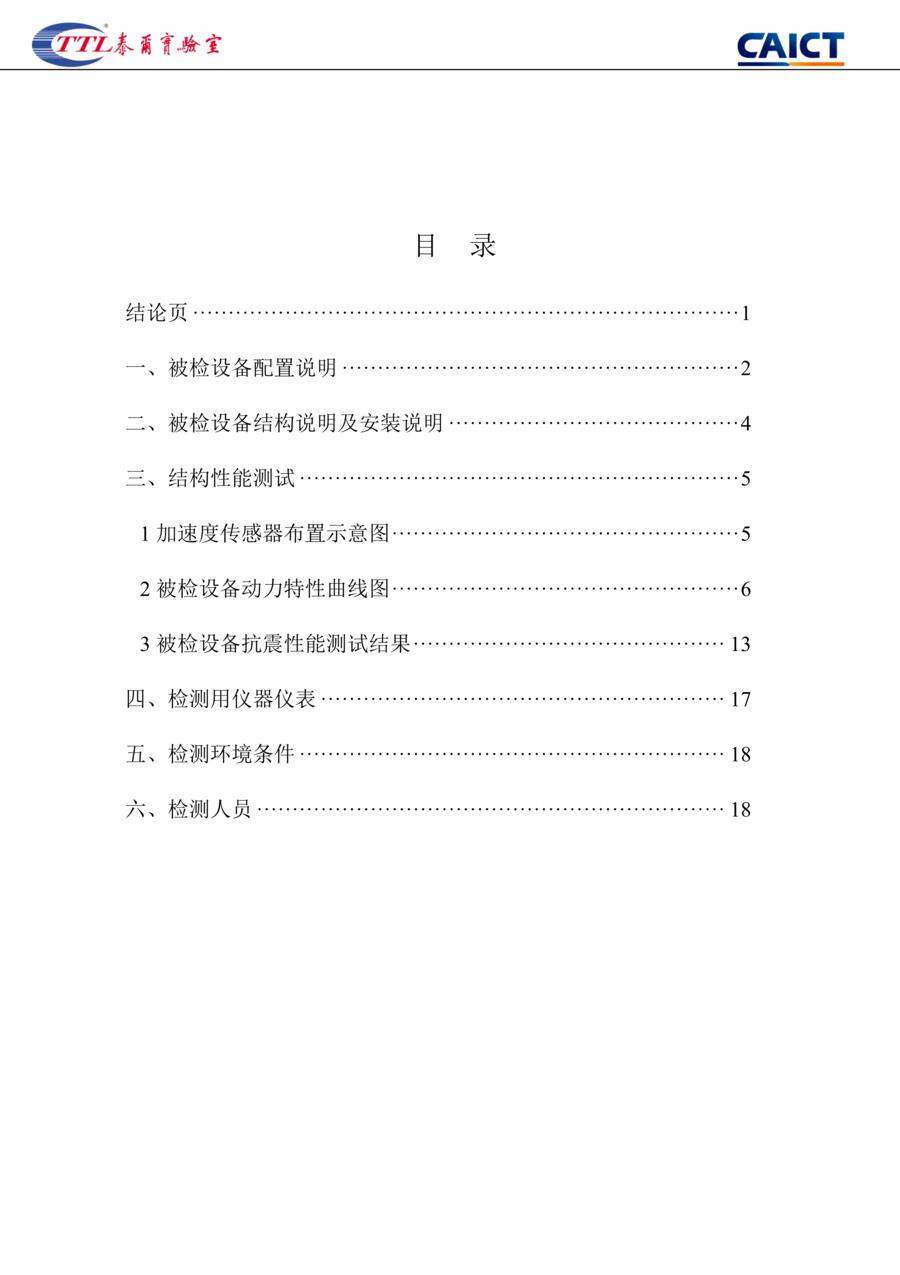
Contents. Conclusion p.1; §1 equipment configuration p.2; §2 structure and installation p.4; §3 structural performance test p.5, with the layout, the curves and the results at p.13; §4 instruments p.17; §5 environment and §6 personnel p.18.
B · Conclusion
-
p.1
Conclusion page. Sample: 1 unit, produced April 2021, submitted by the client. Tested 19 May 2021, issued 1 June 2021, against YD 5083-2005 at intensity 8 and intensity 9. With a 300 kg ballast the equipment met the requirements: PASS.
C · §1 Equipment configuration
-
p.2
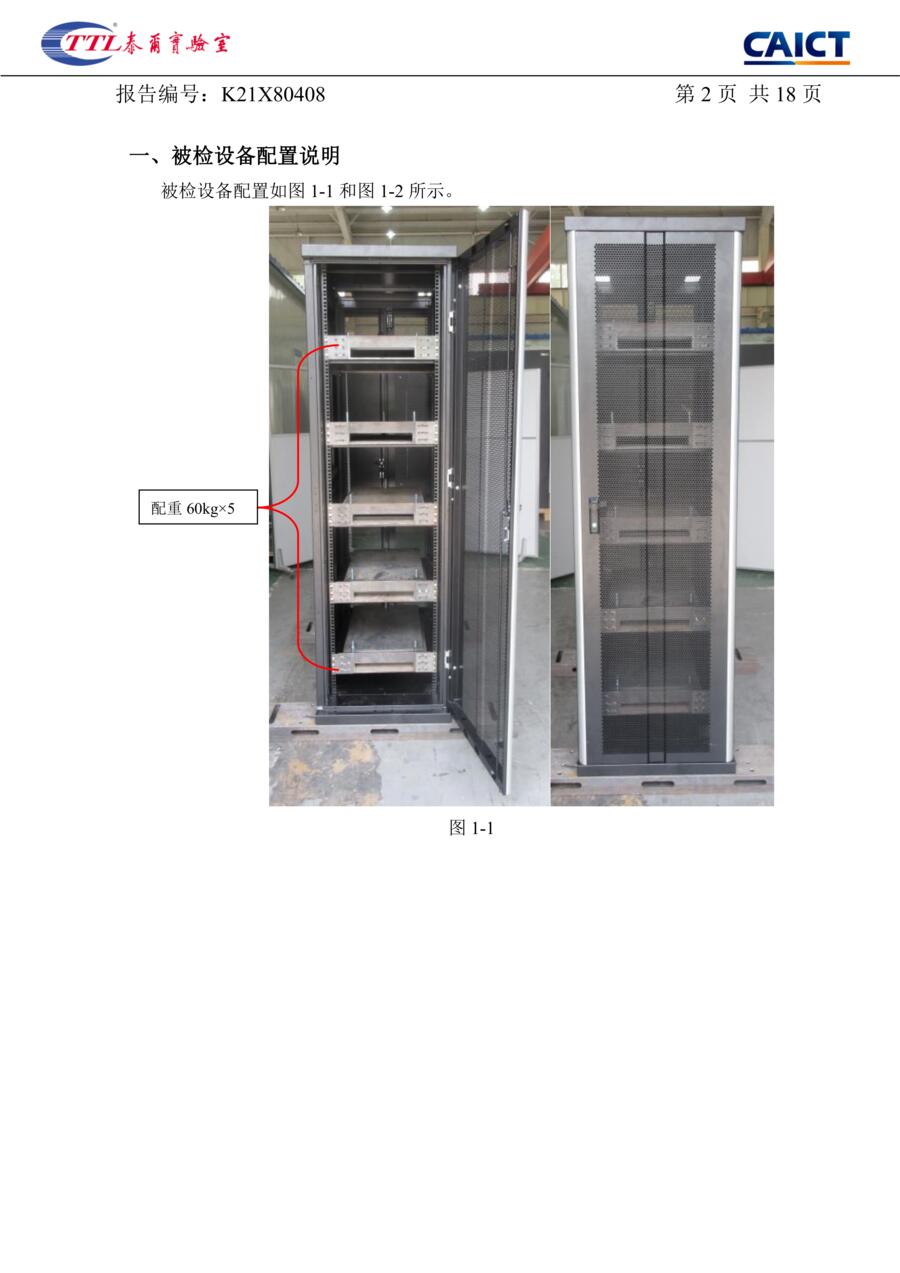
§1 Configuration of the tested equipment, figure 1-1. Doors open: five ballast trays, 60 kg each, 300 kg in total, matching the ballast mass on the conclusion page.
-
p.3
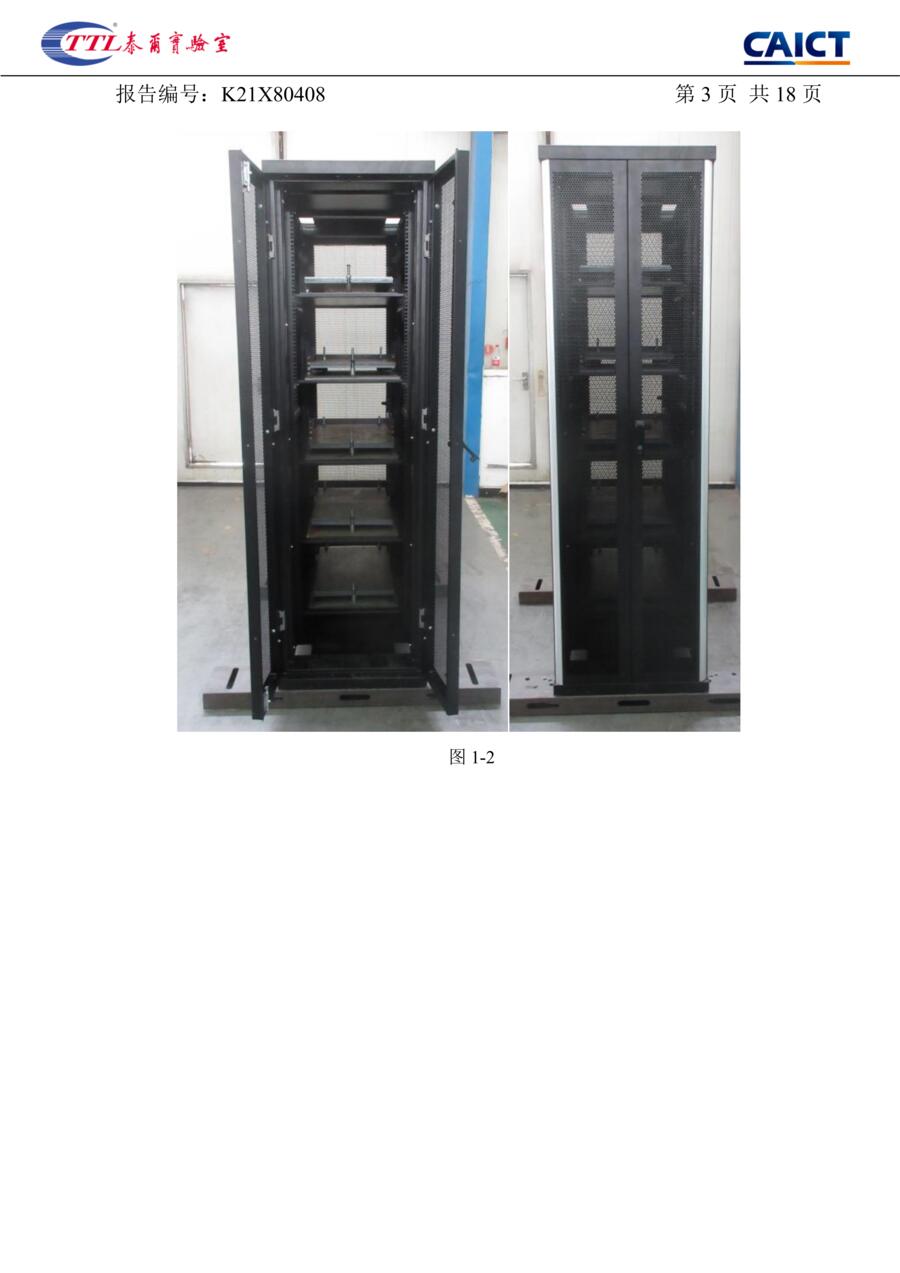
Figure 1-2. The configured sample, doors open and doors closed: a standard 19-inch cabinet with mesh front and rear doors.
D · §2 Structure and installation
-
p.4
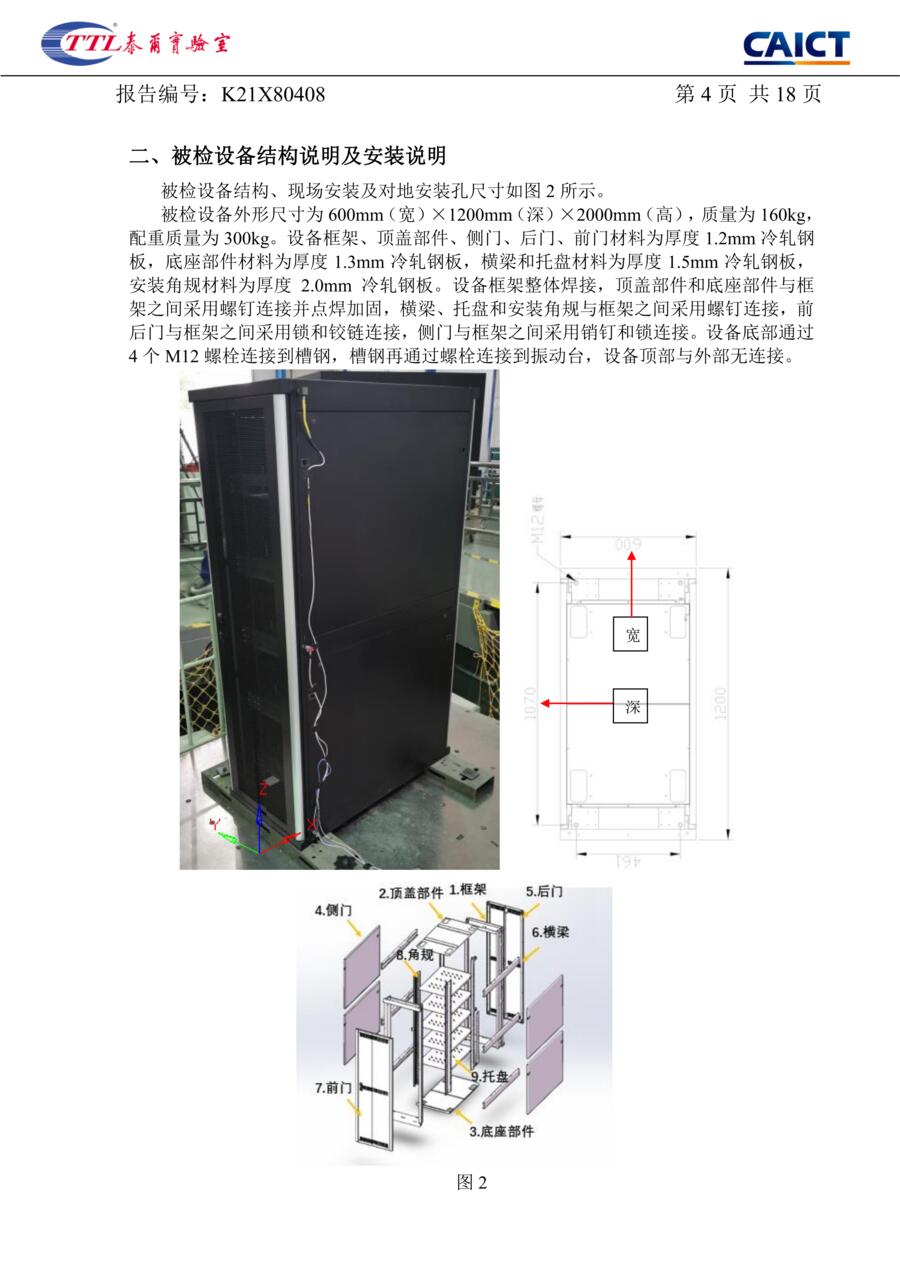
§2 Structure and installation, figure 2. Outline 600 × 1200 × 2000 mm; cabinet 160 kg; ballast 300 kg. The frame is fully welded; roof and base are screwed to it and spot-welded. The base is fixed by four M12 bolts to channel steel, and the channel steel is bolted to the shake table. The top has no external connection.
Material thickness: frame, roof, side panels, rear and front door 1.2 mm; base 1.3 mm; cross-members and trays 1.5 mm; mounting angle rails 2.0 mm.
The report · pages 5–12
The measurement pages: the accelerometer layout and the curve sheets.
E · §3.1 Accelerometer layout
-
p.5
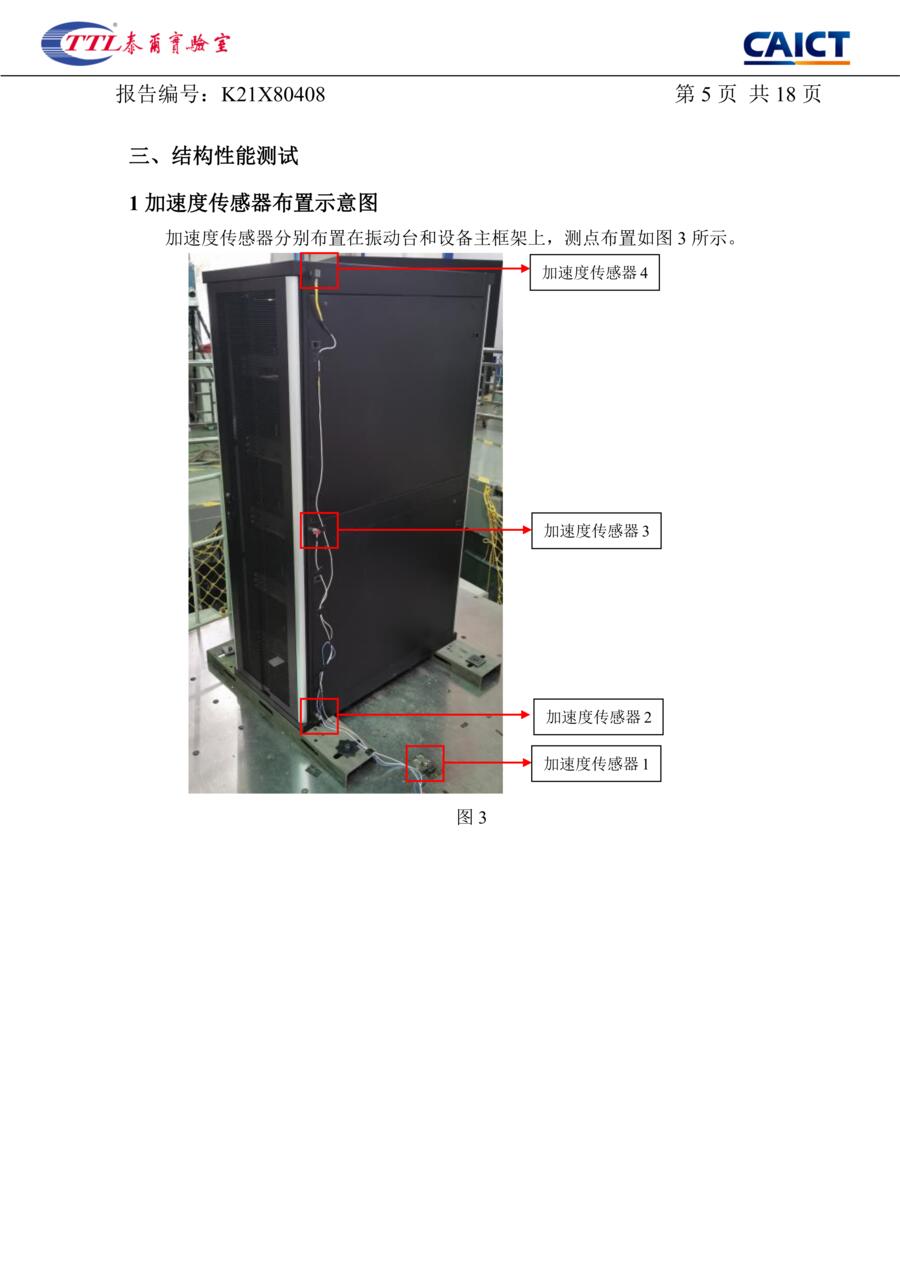
§3.1 Accelerometer layout, figure 3. Four accelerometers: no. 1 on the shake table, no. 2 on the cabinet base, no. 3 at mid-height, no. 4 on the cabinet top.
F · §3.2 Dynamic characteristic and response-spectrum curves
-
p.6
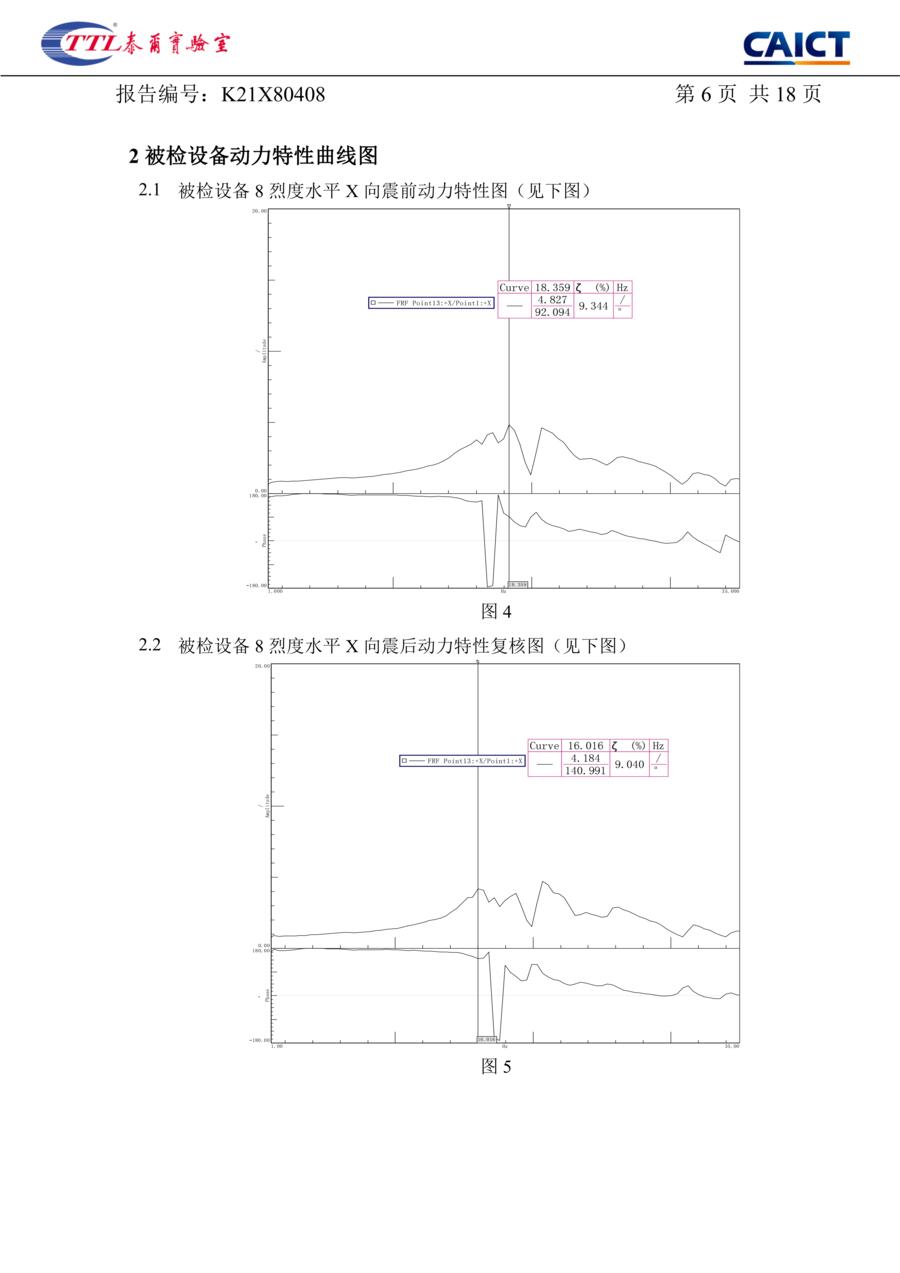
Figures 4 and 5: intensity 8, horizontal X, pre-test and post-test dynamic characteristic curves.
-
p.7
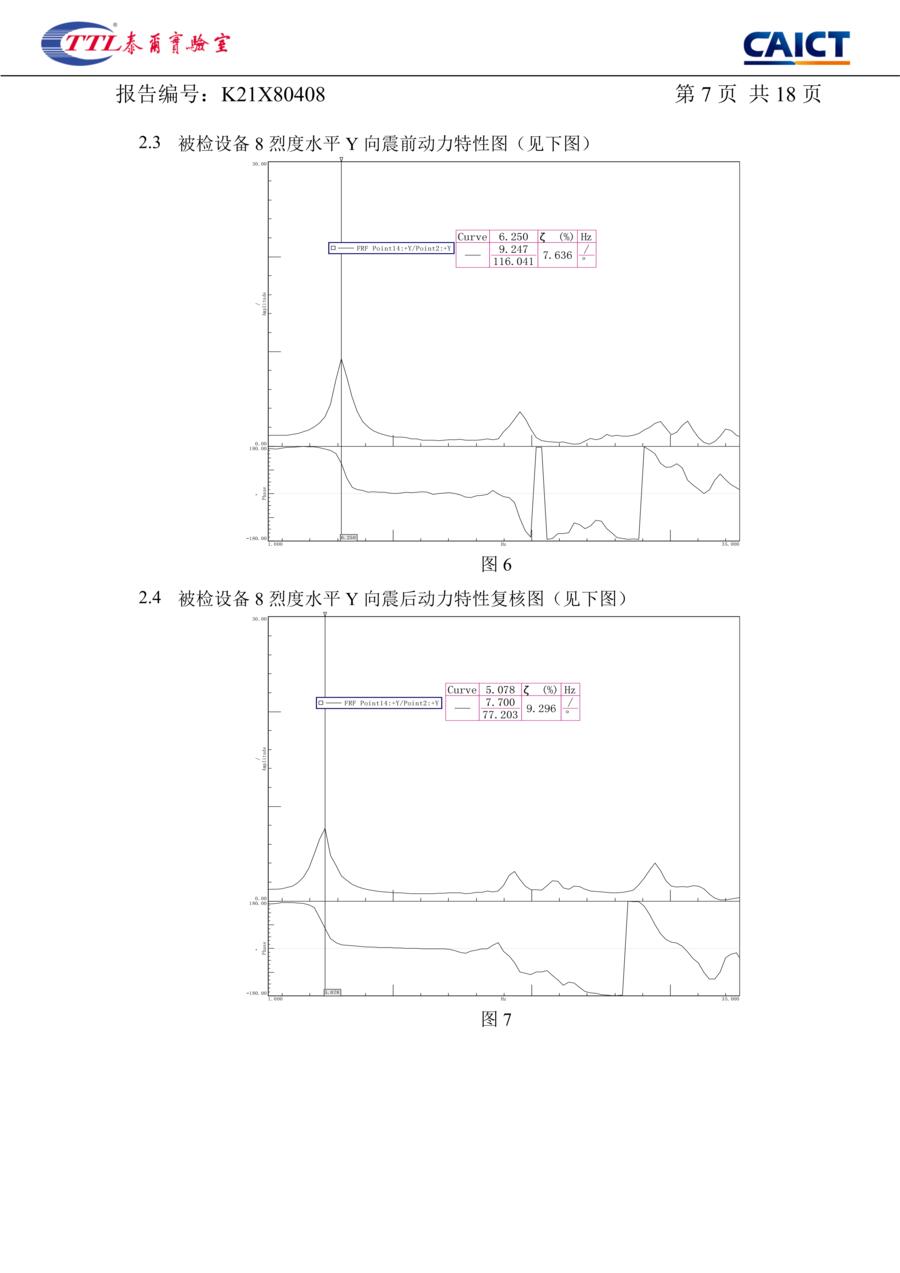
Figures 6 and 7: intensity 8, horizontal Y, pre-test and post-test curves.
-
p.8
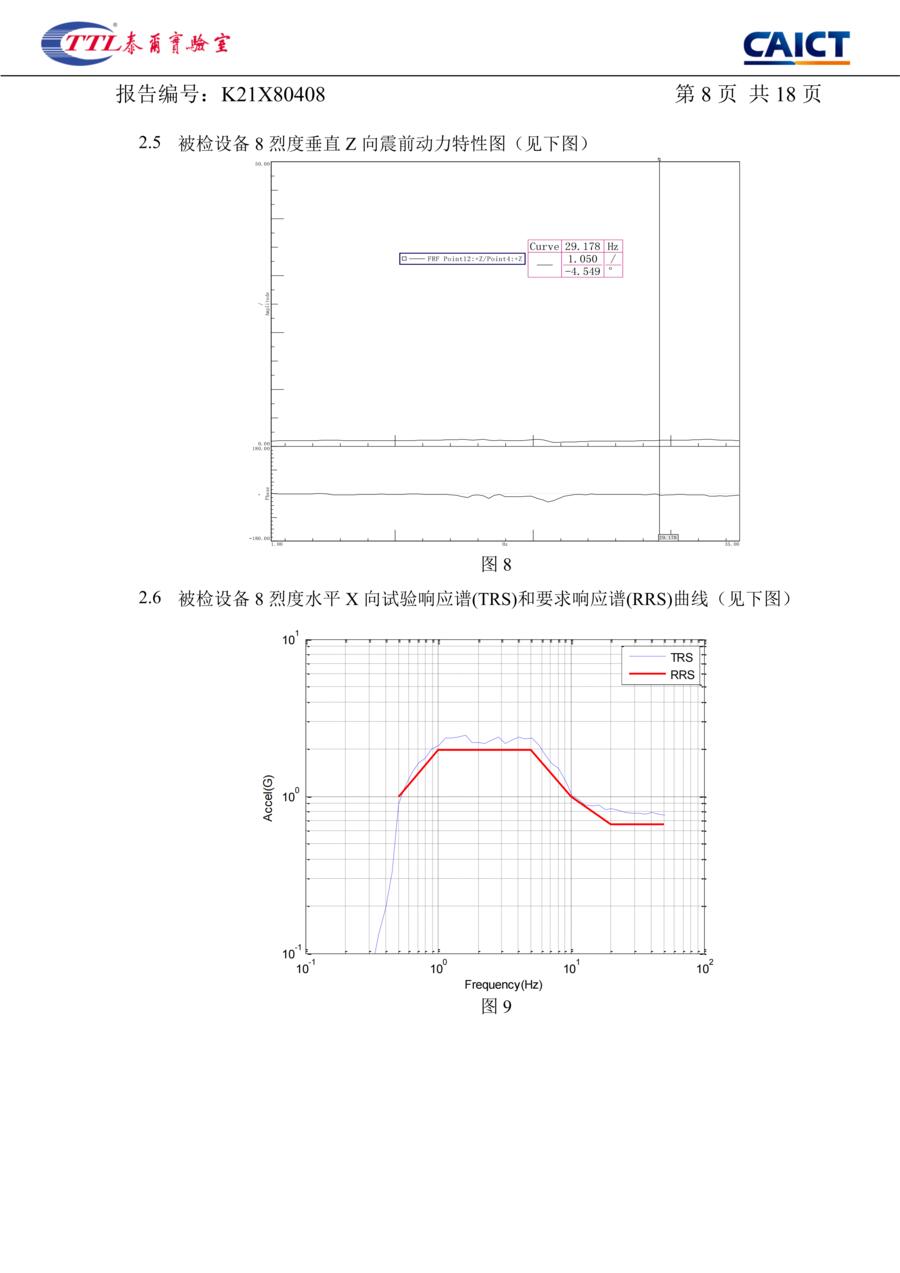
Figure 8: intensity 8, vertical Z, pre-test curve at 29.178 Hz. Figure 9: intensity 8, horizontal X, test response spectrum plotted against the required response spectrum.
-
p.9
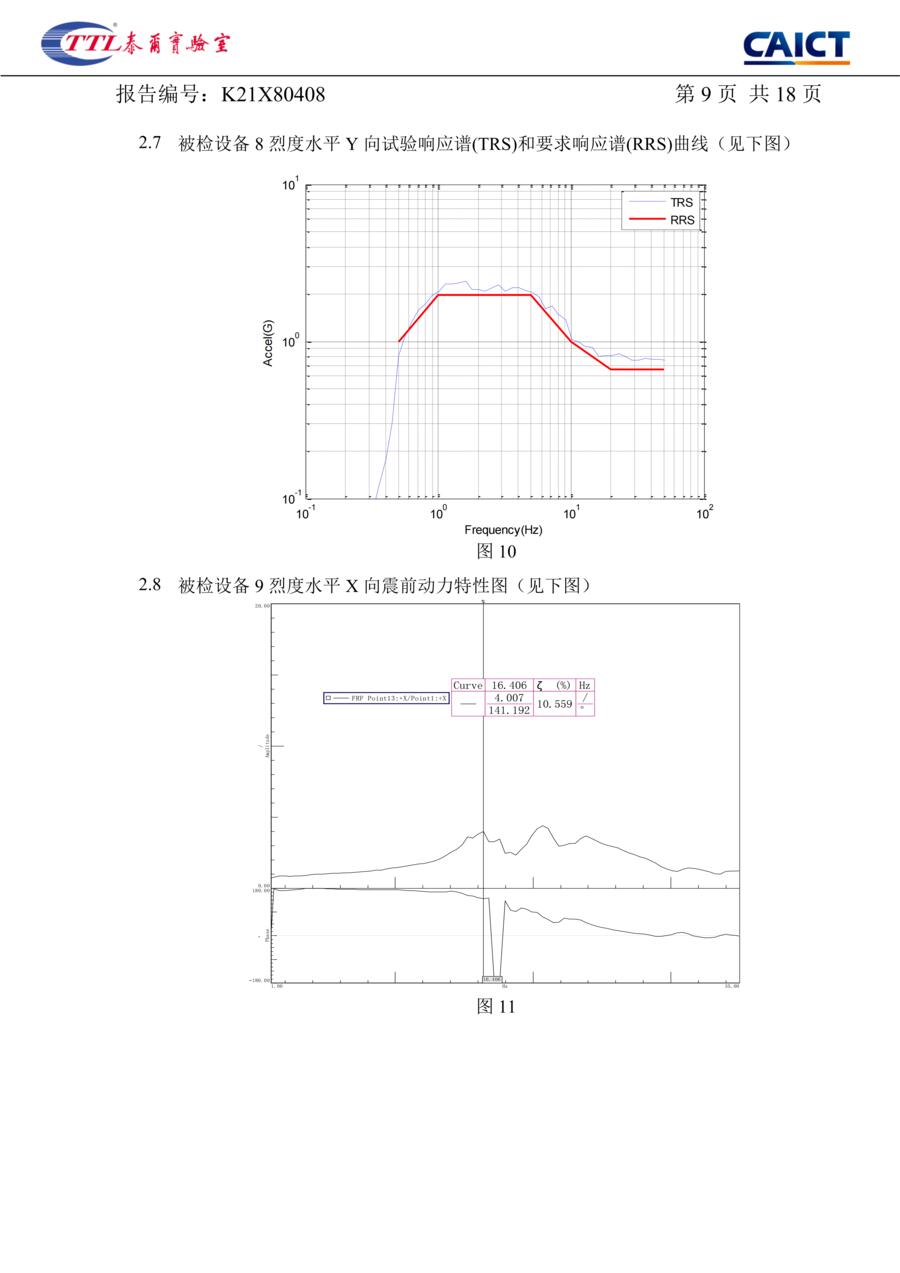
Figure 10: intensity 8, horizontal Y, response spectrum. Figure 11: intensity 9, horizontal X, pre-test curve.
-
p.10
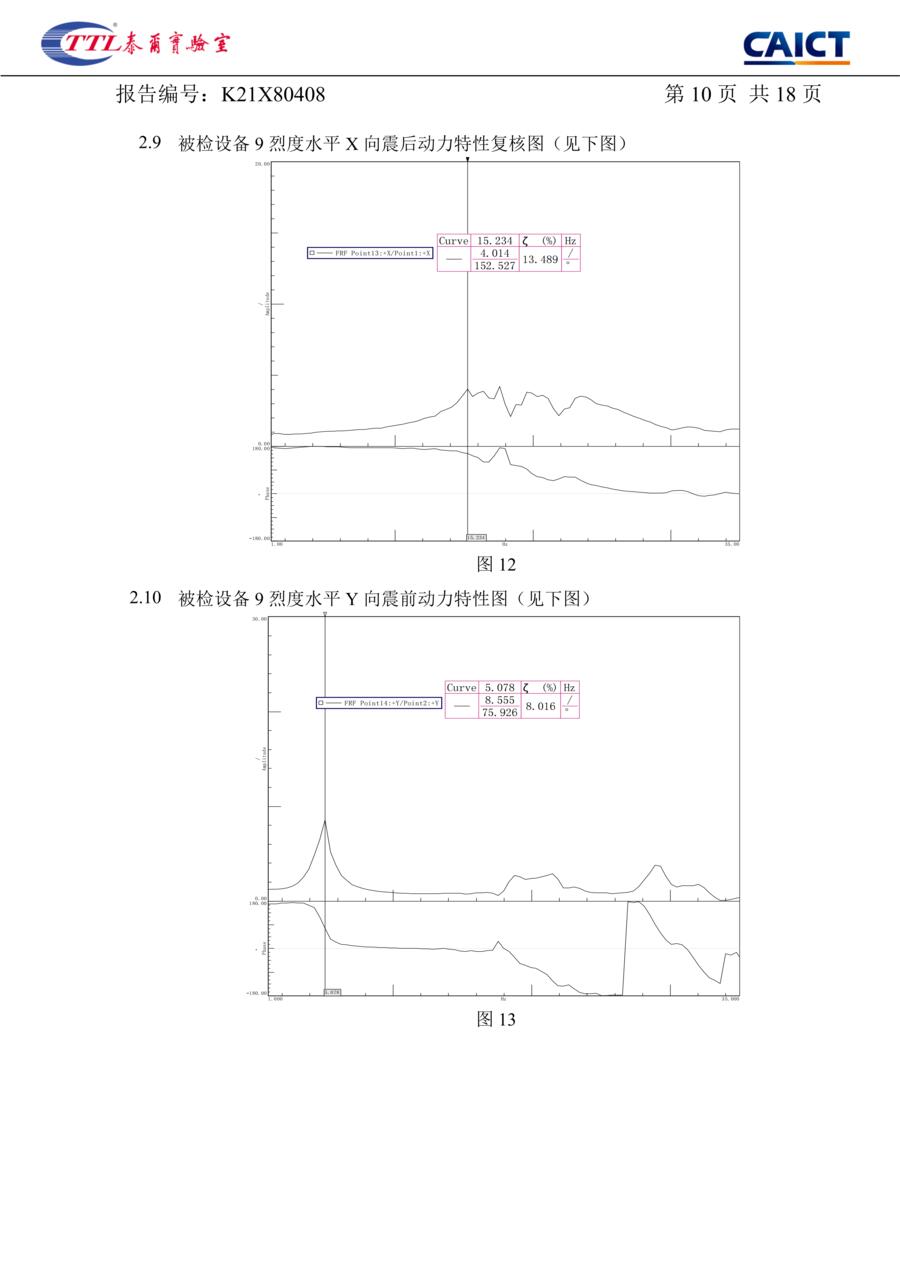
Figures 12 and 13: intensity 9, horizontal X post-test recheck and horizontal Y pre-test.
-
p.11
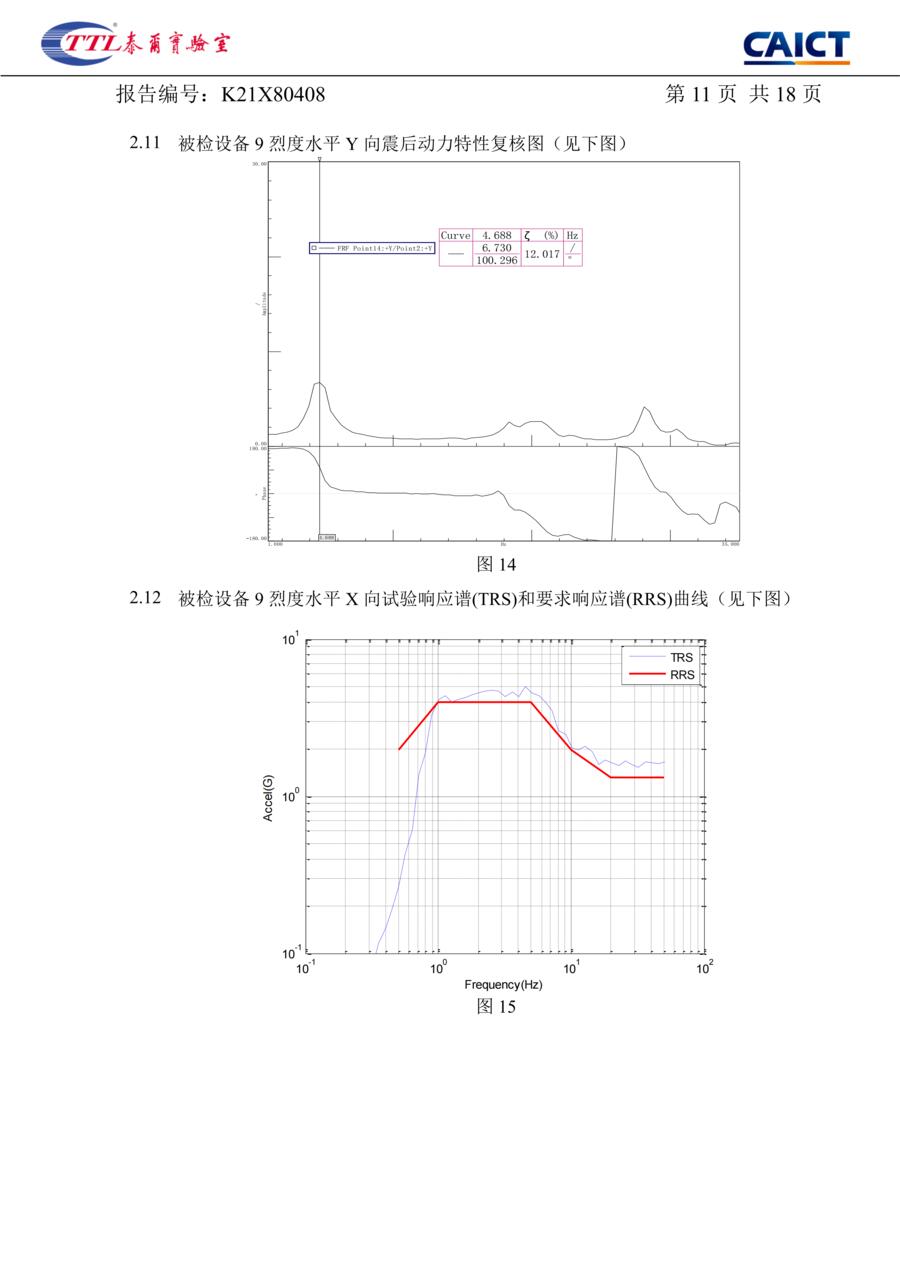
Figure 14: intensity 9, horizontal Y, post-test recheck. Figure 15: intensity 9, horizontal X, response spectrum.
-
p.12
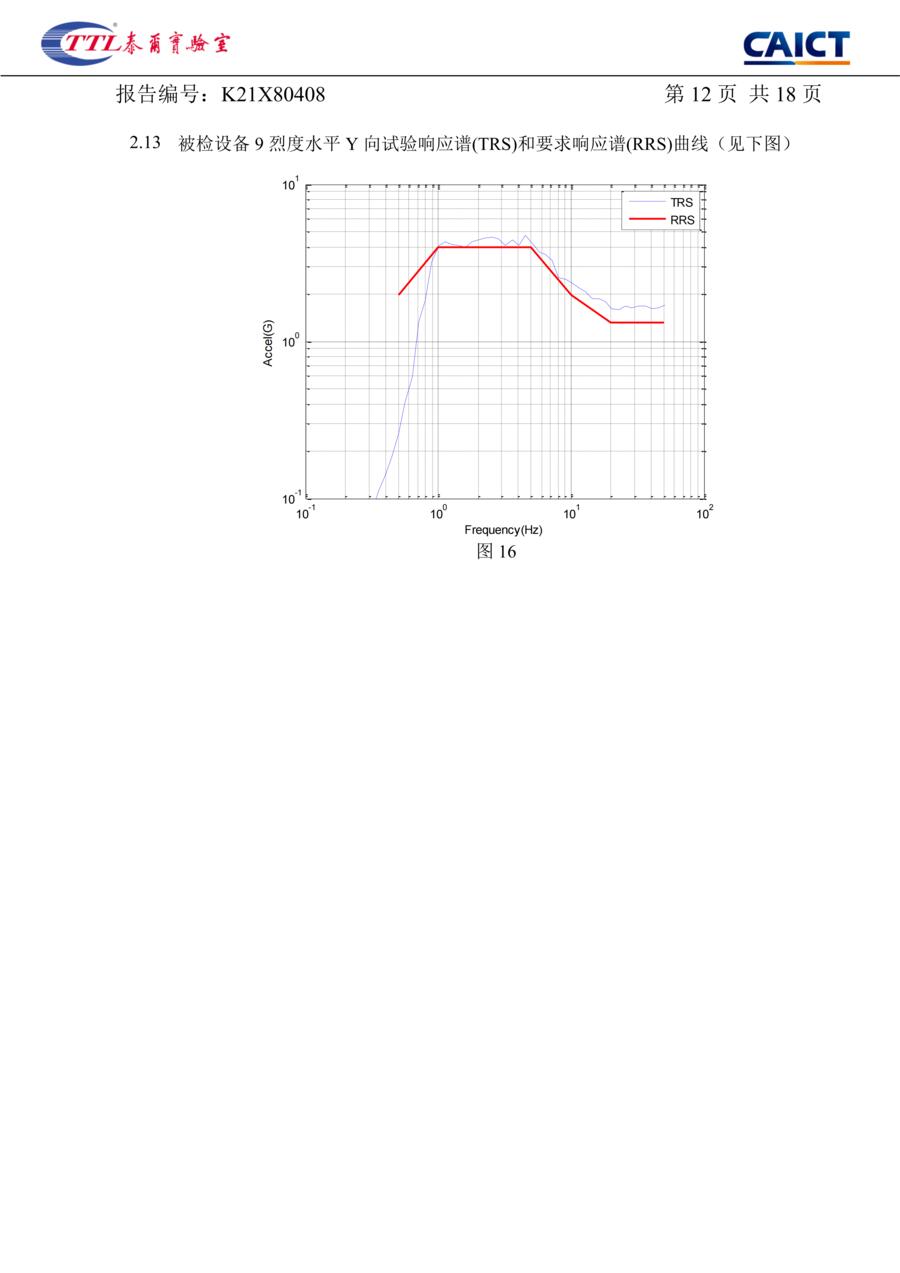
Figure 16: intensity 9, horizontal Y, response spectrum. Thirteen figures over seven sheets.
The report · pages 13–16
The result pages: the four tables, transcribed above.
G · §3.3 Seismic performance results
-
p.13
Table 3.1, dynamic characteristics at intensity 8. Transcribed in full above, as table A.
-
p.14
Table 3.2, seismic assessment at intensity 8. X: 0.660 g input, 0.889 g response. Y: 0.660 g, 2.159 g. No structural damage; PASS in both directions. Basis: YD 5083-2005, chapters 6 and 7, clause 7.0.1.
-
p.15
Table 3.3, dynamic characteristics at intensity 9. Transcribed in full above, as table B.
-
p.16
Table 3.4, seismic assessment at intensity 9. X: 1.320 g input, 1.705 g response. Y: 1.320 g, 4.517 g, double the intensity 8 input. No structural damage; PASS in both directions.
The report · pages 17–18
The closing pages: the instruments, the environment and the personnel.
H · §4 Instruments
-
p.17
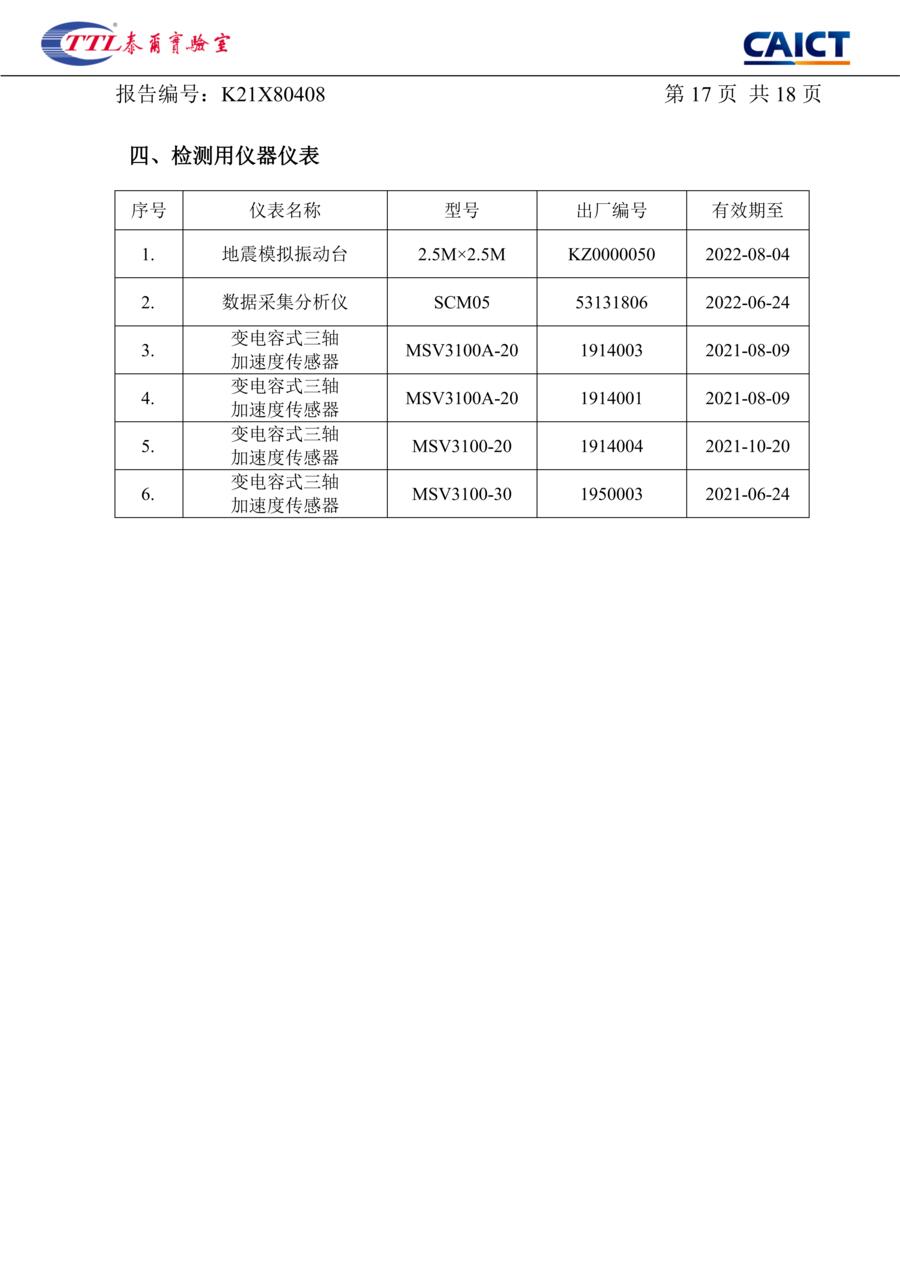
§4 Instruments: a 2.5 m × 2.5 m shake table, a data acquisition and analysis unit, and four capacitive triaxial accelerometers, each listed with its serial number and calibration expiry. All were in calibration on the test date.
I · §5 Environment and §6 Personnel
-
p.18
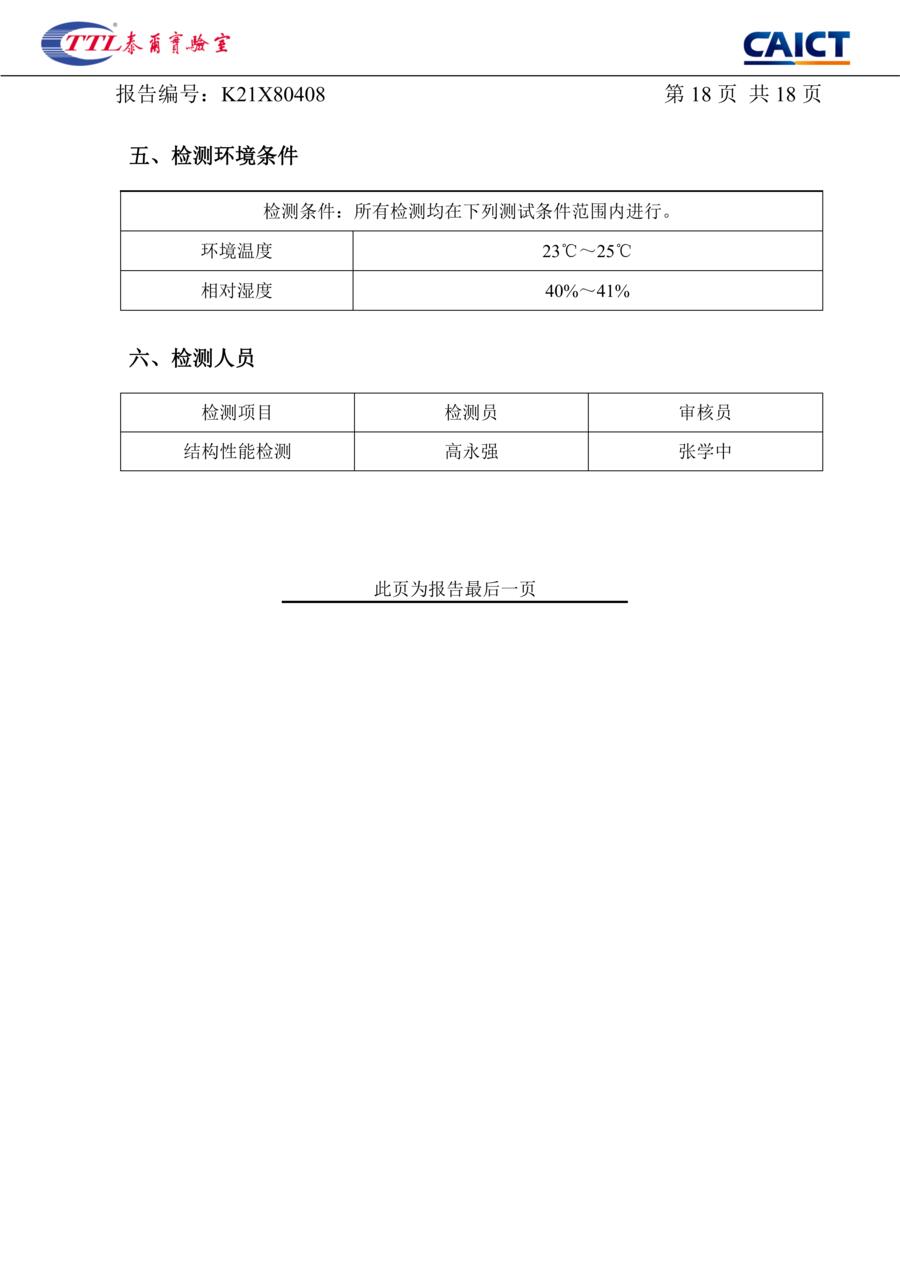
§5 Test environment: 23–25 °C, 40–41 % relative humidity. §6 Personnel: one tester and one reviewer. The page is marked as the last page.
Third-party test report
Load, from the same lab bench
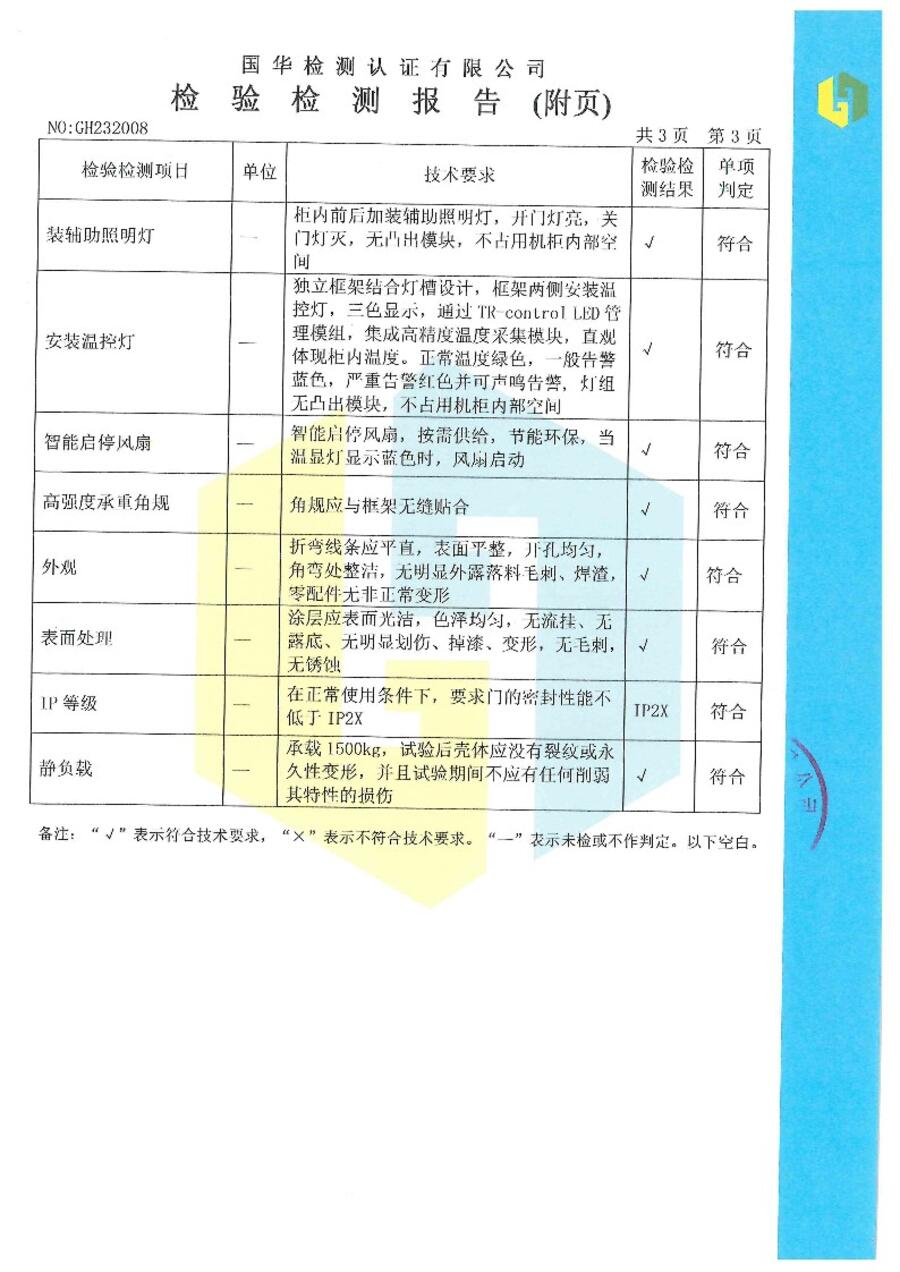
The cabinets were separately load-tested and dimension-checked in a third-party inspection report: outline dimensions, cooling provision, cable routing, door fit, lock and hinge operation, screw protrusion, mechanical connections, salt-mist exposure, surface finish and static load.
Static load: the enclosure was loaded to 1500 kg on reinforced-frame models and showed no cracking and no permanent deformation.
Ratings are model-specific. 1000 kg static load is the standard rating; 1500 kg applies to reinforced-frame models only. Check the drawing for the model you order.
Scope
What this report covers — and what it does not.
Covers
- Structural seismic assessment of one IT cabinet, model TR-61220, ballasted to 300 kg.
- The horizontal X and Y directions, at the input levels for intensity 8 and intensity 9 under YD 5083-2005.
- Natural frequency and damping before and after each level.
Does not cover
- Vertical (Z) direction seismic assessment — the report records it as not assessed.
- Cabinet contents, cable management or live equipment during a quake.
- Facility-level seismic design: an equipment test is not a certification of a building or a data hall.
Ask us for
- The full report as a PDF, so your structural engineer can verify it with the issuing laboratory.
- The static-load inspection report for the model you are specifying.
Ask for the seismic report package
Two fields: the model or drawing you are specifying, and where to send it. If we cannot supply the report for it, we say so.
Ask for the seismic report package